Buyers have the most negotiating power in these NYC markets. (Getty Images)
This home-shopping season marks the third consecutive year of falling home prices in New York City. With inventory expanding, buyers are in a good position to find a deal and negotiate. In certain neighborhoods, they’ll have even more room to bargain. Here, StreetEasy looks at the top buyers’ markets in NYC — cooler markets in which a relative lack of demand means that homes linger on the market and often close for less than their final asking price. That indicates extra room for buyers to negotiate.
Our metric uses four factors to find these neighborhoods: median days on market, the share of price cuts, the median ratio of closing price to initial asking price, and the annual change in the number of contacts from StreetEasy users. A market favoring buyers would have relatively higher days on market, more price cuts, and final sale prices lower than initial asking prices.
To find out where New York home shoppers enjoy the most bargaining power, we divided the market into three price tiers: under $700K, between $700K and $1M, and above $1M.
Buyers at Every Price Point Have Negotiating Power
In general, the more expensive a home, the more buyers can expect to negotiate on its price, both on an actual and percentage basis. The median-priced home in New York City closes at 95% of its initial asking price. In 2019, the median buyers paid 97% of the initial price in neighborhoods below $700K and 90% of the asking price in neighborhoods above $1M.
| Rank | Neighborhood | Median Price | Sale-to-List Price Ratio |
|---|---|---|---|
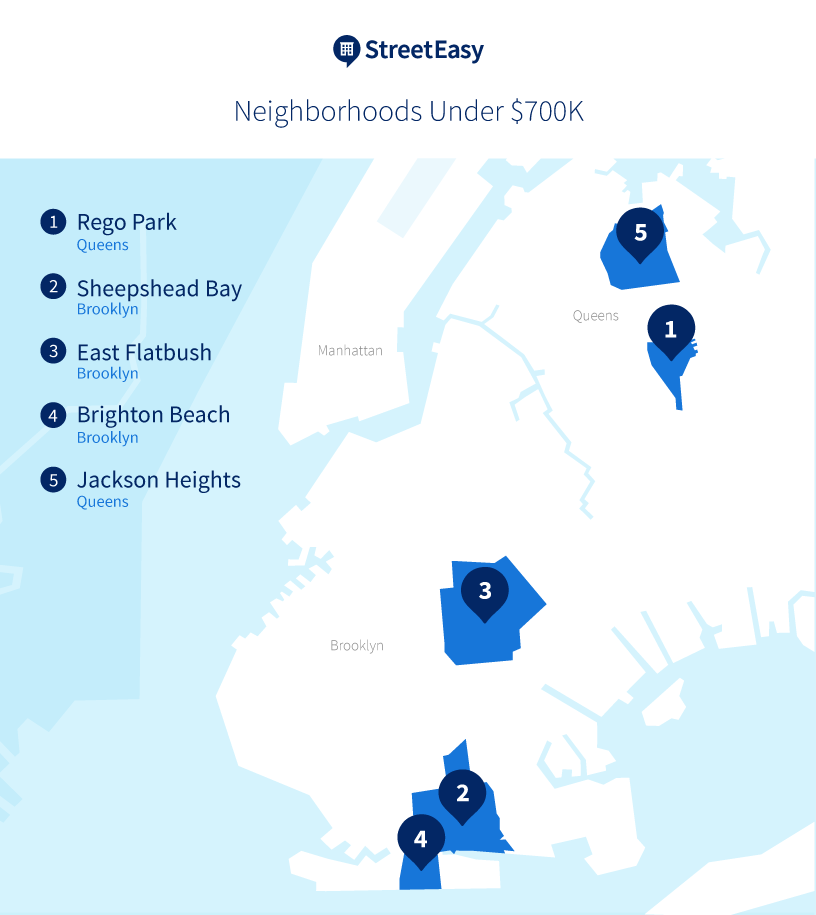
| 1 | Rego Park, Queens | $429,999 | 95% |
| 2 | Sheepshead Bay, Brooklyn | $699,000 | 93% |
| 3 | East Flatbush, Brooklyn | $649,000 | 97% |
| 4 | Brighton Beach, Brooklyn | $619,500 | 94% |
| 5 | Jackson Heights, Queens | $459,000 | 97% |
Buyers looking in neighborhoods with median prices below $700K are already finding relatively good deals, so the final price that buyers in 2019 paid ended up being closer to the initial asking price. For example, in East Flatbush and Jackson Heights, the sale-to-list ratio in 2019 was 97 percent. Buyers looking in Rego Park and Brighton Beach should take comfort in the fact that the typical home there closed for 93 or 94 percent of its initial asking price.
 The good news is that four of the five Top Buyers’ Markets for NYC buyers on a budget are among StreetEasy’s 10 Best Neighborhoods for First-Time Home Buyers. These neighborhoods have the most homes affordable to New Yorkers ages 25–44 who earn the median annual household income of $70,406.
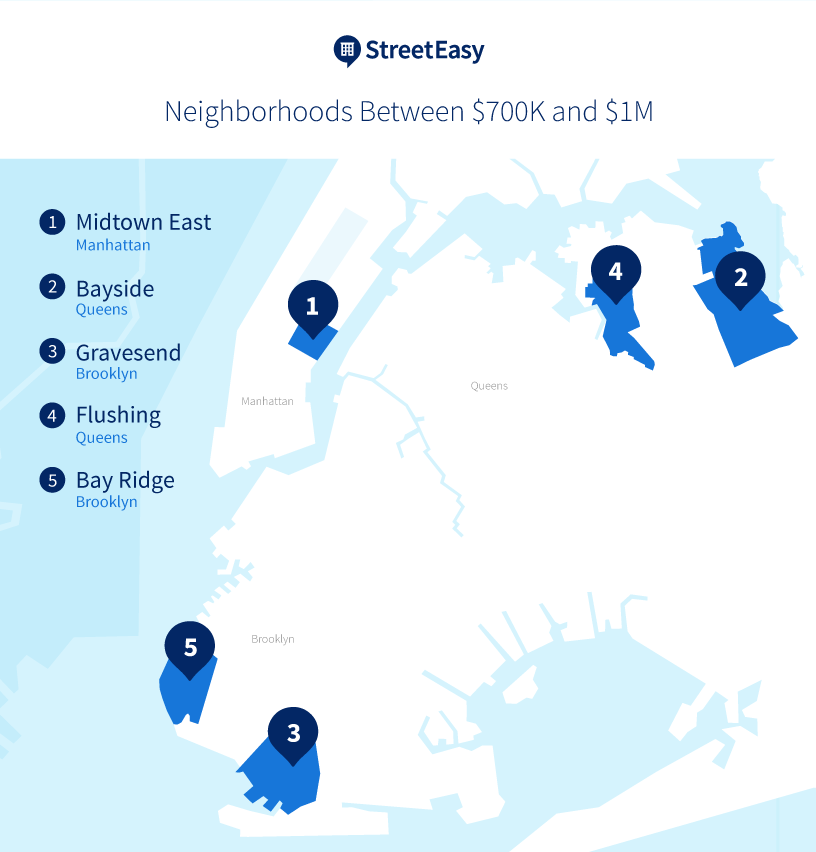
| Rank | Neighborhood | Median Price | Sale-to-List Price Ratio |
|---|---|---|---|
| 1 | Midtown East, Manhattan | $899,000 | 94% |
| 2 | Bayside, Queens | $717,000 | 93% |
| 3 | Gravesend, Brooklyn | $799,000 | 93% |
| 4 | Flushing, Queens | $786,668 | 93% |
| 5 | Bay Ridge, Brooklyn | $739,000 | 94% |
In all NYC neighborhoods where the median price of a home falls between $700K and $1 million, the median home was sold in 2019 at a discount of between 6% and 7% off the original asking price. In Midtown East, then, buyers paid nearly $54,000 less than the initial asking price of the median home.
And while a 6% to 7% percent discount on a home isn’t that much higher than the citywide discount of 5%, the markets in these neighborhoods are cooler than those elsewhere in the city. The typical home spent between 84 days (in Bay Ridge) and 101 days (in Flushing) on the market before it sold. These neighborhoods also had fewer contacts from StreetEasy users in 2019 than in 2018. As these markets continue to stagnate in 2020, buyers should feel empowered to negotiate even more.
 Buyers looking for more affordable options should note that Midtown East and Bay Ridge in the mid-tier of homes are also among the top 10 neighborhoods with the highest concentration of affordable options for first-time home buyers.
| Rank | Neighborhood | Median Price | Sale-to-List Price Ratio |
|---|---|---|---|
| 1 | Financial District, Manhattan | $1,335,000 | 93% |
| 2 | Upper East Side, Manhattan | $1,535,000 | 93% |
| 3 | Midtown, Manhattan | $1,850,000 | 90% |
| 4 | Tribeca, Manhattan | $3,995,000 | 93% |
| 5 | Battery Park City, Manhattan | $1,197,000 | 92% |
Buyers eyeing neighborhoods in Manhattan where median sale prices are above $1 million are likely dealing with sellers whose homes have lingered on the market for multiple months.
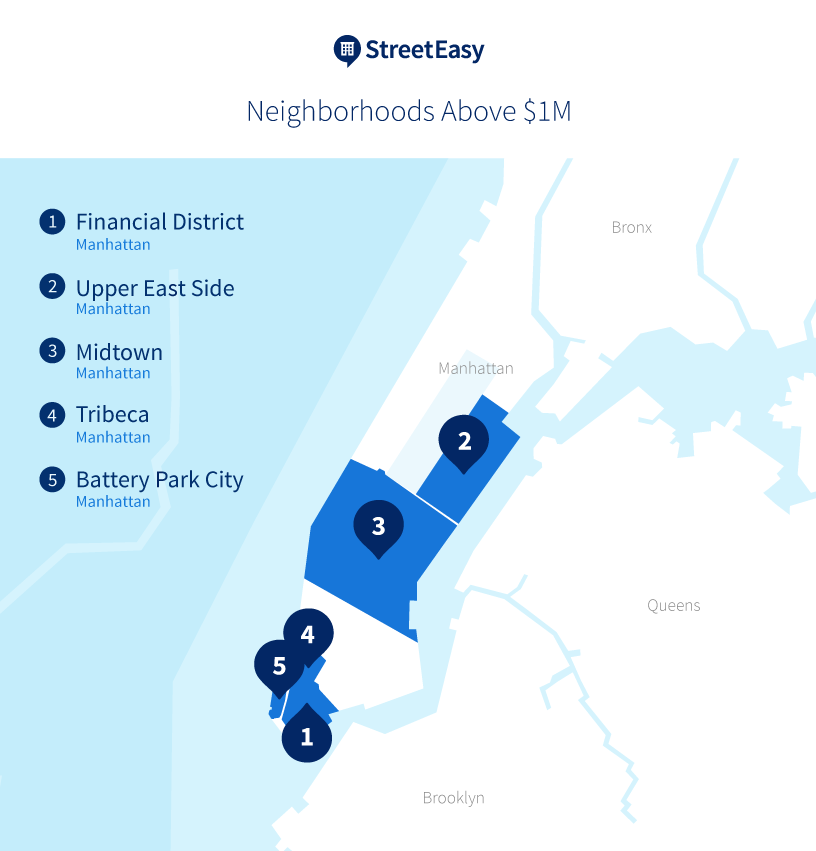 These homes stay on the market for as long as 142 days in Midtown, which was the slowest market among the luxury tier neighborhoods, and the neighborhood where buyers with a high budget found the biggest deals in 2019. While buyers in Midtown got the highest discounts at 10% off initial asking prices, other factors from our analysis, such as the share of price cuts and the change in StreetEasy contacts, still put FiDi and the Upper East Side at numbers one and two.
Sellers Should Price Strategically or Prepare to Give Discounts
Sellers in these top NYC buyers’ markets should prepare for a multi-month sale process — one that will likely involve a price cut while the home is on the market, and some additional negotiation before a contract is signed.
Our prior research finds that most price cuts are too small and come too late to be effective. Failure to attract buyers after many weeks on the market is a signal that the pricing is wrong. To speed up the sales process, sellers and agents should do all the research they can to price strategically. The StreetEasy Data Dashboard is a good place to start to compare and download StreetEasy’s internal data on sales across similar homes and neighborhoods.
Even in this tepid market, home sellers in certain neighborhoods enjoy a stronger hand. Check out the neighborhoods where homes are more likely to sell quickly, and for an amount closer to their asking price, in our analysis of the Top Markets for Home Sellers.
How We Did It
To determine NYC neighborhoods where either home buyers or sellers have more negotiating power, StreetEasy created the Buyer/Seller Index. The index combines the sale-to-list price ratio, the percent of homes with a price cut, the number of days homes spent on the market on StreetEasy, and the annual change in StreetEasy user contacts on listings in each neighborhood. Relative to other neighborhoods in NYC, buyers markets are those with a higher index value, where homes are more likely to see a price cut, sell more slowly, have sale-to-list price ratios farther from 100, and have fewer user contacts on StreetEasy. Data comes from 2019 data on StreetEasy sales and public sale records from the New York City Department of Finance. The neighborhoods on the list have a minimum of 250 sales in 2019.
—
Inspired to find your next place in New York? Whether you’re looking to rent or to buy, search NYC apartments on StreetEasy.