
StreetEasy’s January 2020 Market Reports show high demand and low inventory for the most affordable segment of the Manhattan market. (Getty Images)
The sluggish Manhattan sales market persisted in January, but one segment of the market is heating up. In the bottom 20% of the Manhattan market, home prices bucked the wider trend, rising 8.9% to $480,438, according to the StreetEasy Price Index [i].
The increase in prices at the low end of the market signals heightened demand for affordable options in Manhattan. Unfortunately for buyers with lower budgets, this market segment offers the fewest number of homes to choose from. Even with a slight 1.6% uptick in inventory, the lowest price tier had 1,005 homes on the market. That’s 353 fewer than the next segment up, where the StreetEasy Price Index was $716,604 in January. The luxury tier, or the top 20% of the market, had 3,366 homes on the market — a 9.5% increase from January 2019.
While prices fell in the top four quintiles and nearly all Manhattan submarkets, they remained steady in Upper Manhattan [ii] at $636,869. This is the cheapest submarket in the borough and includes neighborhoods such as Inwood and Washington Heights. Buyers with smaller budgets will continue to have the best luck looking there while it remains relatively affordable. The number of homes for sale also increased by 6.5% in the area, a welcome sign for those buyers seeking affordability.
“Even as the city experiences a slowdown in the sales market, the cost of entry to homeownership continues to move further out of reach for many potential buyers,” says StreetEasy Economist Nancy Wu. “Demand for affordable housing options is consistently strong. But it’s likely that first-time buyers and those with lower budgets will feel the competition even more acutely this upcoming home shopping season.”
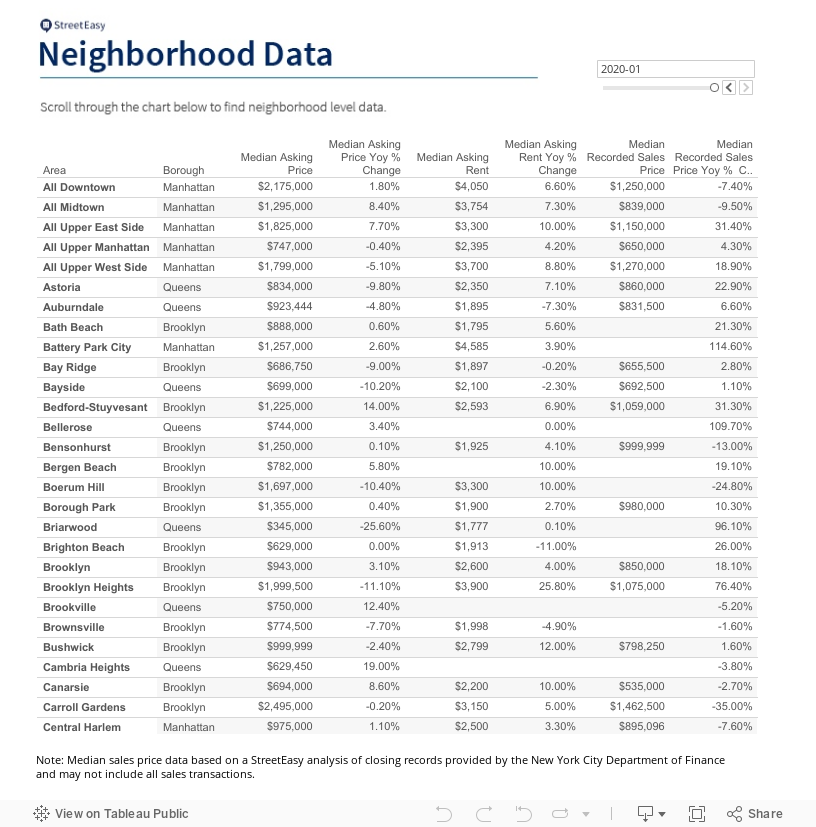
See below for additional sales and rental market trends across Manhattan, Brooklyn and Queens.
Manhattan Homes Are Lingering on the Market
The Manhattan sales market kicked off the year where it left off, with prices down 2.8% to $1,089,060. This was the smallest annual decline in prices since October 2018. Meanwhile, Manhattan homes lingered on the market for nearly four months (119 days). This length of time has not been seen since 2012. As home-shopping season approaches, buyers should be ready to negotiate appropriately.
Brooklyn Is the Only Borough Where Sales Prices Increased
All signs point to a more competitive Brooklyn sales market in 2020. Brooklyn was the only borough analyzed where sales prices rose — up 1.4% to $707,436. This was the first increase in the borough since late 2018, and a welcome sign for Brooklyn sellers trying to strike a deal. As prices rose, discounts simultaneously became harder to find. One in 10 Brooklyn homes for sale had a price cut in January, a decline of 1.9 percentage points from a year prior.
Queens Market Is Cooling Down
Mostly unaffected until now, Queens is starting to feel the broader slowdown in the sales market. Prices rose steadily in the borough from 2012 to 2019 as buyers looked here for relative affordability. But price growth has significantly slowed in the past several months. In January, the StreetEasy Queens Price Index stagnated at $507,322. Queens also had the smallest share of price cuts of all boroughs analyzed with 9.6% of homes getting a discount in January.
The complete StreetEasy Market Reports [iii] for Manhattan, Brooklyn, and Queens, with additional neighborhood data and graphics, can be viewed here. Definitions of StreetEasy’s metrics and monthly data from each report can be explored and downloaded via the StreetEasy Data Dashboard.
[i] The StreetEasy Price Indices track changes in resale prices of condo, co-op, and townhouse units. Each index uses a repeat-sales method of comparing the sales prices of the same properties since January 1995 in Manhattan and January 2007 in Brooklyn and Queens. Given this methodology, each index accurately captures the change in home prices by controlling for the varying composition of homes sold in a given month. Levels of the StreetEasy Price Indices reflect average values of homes on the market. Data on the sale of homes is sourced from the New York City Department of Finance. Full methodology here.
[ii] The Upper Manhattan submarket includes Hamilton Heights, Washington Heights, Inwood, West Harlem, Central Harlem, East Harlem, Manhattanville, and Marble Hill.
[iii] The StreetEasy Market Reports are a monthly overview of the Manhattan, Brooklyn, and Queens sales and rental markets. Every three months, a quarterly analysis is published. The report data is aggregated from public recorded sales and listings data from real estate brokerages that provide comprehensive coverage of Manhattan, Brooklyn, and Queens, with more than a decade of history for most metrics. The reports are compiled by the StreetEasy Research team. For more information, visit https://streeteasy.com/blog/research/market-reports. StreetEasy tracks data for all five boroughs within New York City, but currently only produces reports for Manhattan, Brooklyn, and Queens.
—
Inspired to find your next place in New York? Whether you’re looking to rent or to buy, search NYC apartments on StreetEasy.