Key Takeaways:
- Contracts across the city are down more than 5% as declining new inventory continues to plague the market.
- The NYC median asking price was $1.1M in March — a record high since 2017 — with 27 neighborhoods seeing median asking prices over $1M.
- Well-priced listings are selling fast, as homes that entered contract in March were priced 1.5% below similar listings and spent a median of just 58 days on the market.
The recent decline in mortgage rates from 7.6% in October to 6.8% in March has increased buyers’ purchasing power. While affordability is improving, mortgage rates need to decline further for many sidelined buyers to rejoin the market. Against this backdrop, 2,284 homes entered contract citywide in March, 5.2% fewer than in March of last year.
Another challenge for NYC buyers is the shortage of new listings to choose from. Just 4,114 homes were listed for sale in March, 1.6% fewer than a year ago. Nearly 44% of NYC homeowners owned their homes free and clear as of 2022 — slightly higher than Zillow’s estimate that nationally, 41% of homeowners do not have any outstanding mortgage. But new listings continue to decline in NYC, while they are rising nearly 20% across the country. The declining number of newly listed homes suggests NYC homeowners, regardless of current mortgage status, remain reluctant to trade in for a new home at today’s much higher rates amid an uncertain economic climate. Limited new listings also signals a competitive spring season in the sales market this year.
NYC Asking Prices Remain at Record Highs, But Buyers Are Retaking the Upper Hand
The median asking price in NYC was $1.1M in March, 10.4% higher than a year ago. Across the nation, there are currently 550 cities — including 66 in the NYC metro area — where typical home values are above $1M or more, up from 491 a year ago, according to Zillow® research. According to StreetEasy® data, there were 27 “million-dollar neighborhoods” in New York City alone where the typical asking price was above $1M, an increase from 24 in March 2023.
Despite high asking prices, buyers are now regaining the upper hand with ample room for negotiation. The typical NYC home received 95.2% of its asking price in March, slightly higher than 94.6% a year ago. The current median sale-to-list price ratio is close to what it was in March 2019 (95.1%), when a glut of unsold condos led to a buyer’s market in NYC. It’s also well below March 2022 (97.1%) when sellers held the edge amid inventory shortages.
Buyers Are Finding the Most Room for Negotiation in Manhattan
With the median asking price at nearly $1.6M this March, sellers in Manhattan must appeal to a smaller pool of buyers with higher incomes and savings. Amid higher financing costs and an uncertain economic outlook, wealthy New Yorkers are increasingly considering luxury rentals over buying in Manhattan. In March, just 1,068 homes entered contract in the borough, down 10.3% from a year ago.
While the current median asking price in the borough is still 7% higher than a year ago, buyers can expect more room for negotiation in Manhattan: a typical home sold in March received 94.3% of its initial asking price, compared to 96.5% in Brooklyn. While it’s typical for highly priced homes to sell with larger discounts, the current median sale-to-list price ratio in Manhattan is below its March 2019 level of 94.7%, when sales failed to keep pace with new condos on the market.
Limited New Listings Will Keep the Sales Market Busy, With Brooklyn Leading the Way
While buyers will likely see room for negotiation this spring, limited new listings will keep the sales market competitive. Well-priced listings are selling fast in NYC: homes that entered contract in March were priced 1.5% below similar listings in the neighborhood on average, and spent a median of just 58 days on the market.* By comparison, all homes still on the market in NYC have already spent a median of 161 days as of this writing.
Due to declining new listings, the market in Brooklyn will likely be more competitive than other boroughs this spring. In Brooklyn, just 1,072 homes were new to the market in March, a 4.8% decline from a year ago. Combined with resilient demand from buyers, the borough’s median asking price soared 17.8% year-over-year to nearly $1.1M — the highest since 2010 when StreetEasy started tracking this metric.
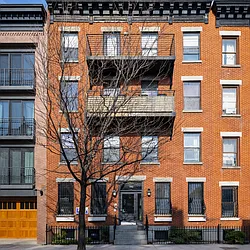
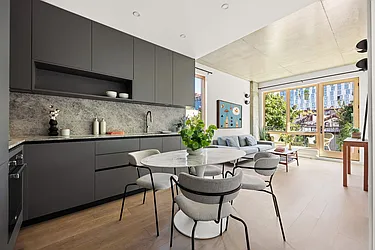
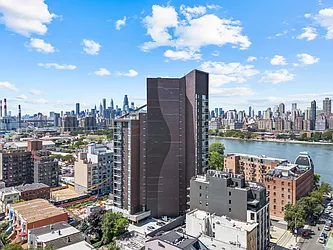
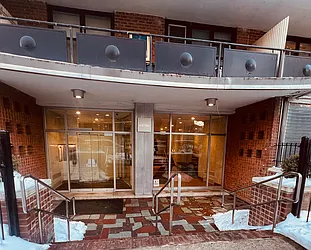
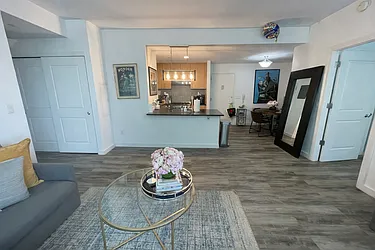
Manhattan Homes Under $1.5M on StreetEasy Article continues below
Competition among buyers for well-priced listings is fueling bidding wars in Brooklyn. Of all listings sold in the borough, 21% — about one in five — were sold above asking in Q1. This is double compared to Manhattan, where one in ten homes was sold above asking.
Buyer Demand for Brooklyn Brownstones Remains Resilient
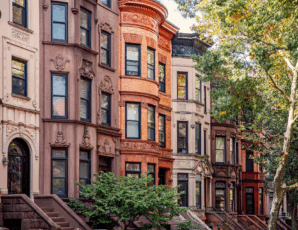
In Brooklyn, 645 homes entered contract in March, an 8.8% decline from last year, but the townhouse market in the borough saw a strong start to spring. Across “brownstone Brooklyn,” including neighborhoods like Cobble Hill, Fort Greene, and historic districts of Bedford-Stuyvesant, 26 townhouses entered contract in March, compared to 14 in February of this year and 31 in March 2023. Despite the slower pace of sales earlier this year, the Brooklyn townhouse market’s current sales volume is similar to Manhattan, where 24 townhouses entered contract in March.
The median asking price of townhouses in brownstone Brooklyn was $3.9M in March, up 15.6% from a year earlier. The neighborhoods that saw the most townhouses entering contract in the borough were Park Slope (13), Carroll Gardens (4), and Boerum Hill (3).
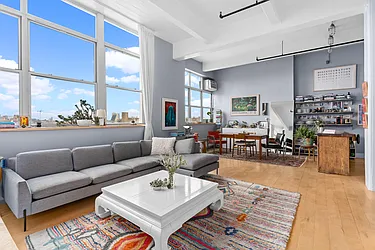
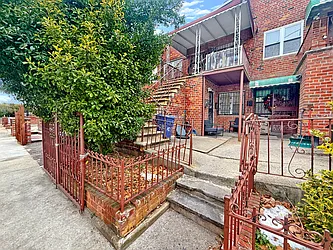
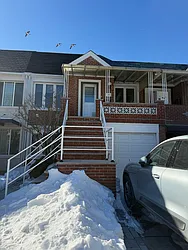
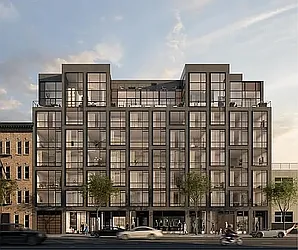
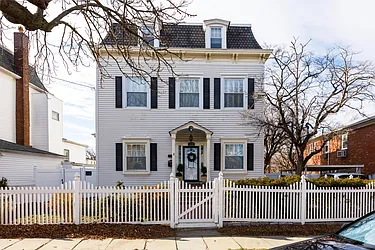
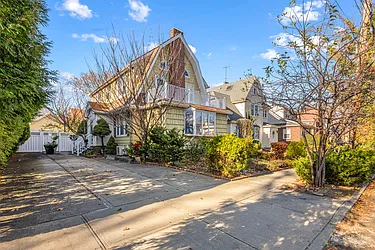
Brooklyn Homes Under $1.5M on StreetEasy Article continues below
The Sales Market in Queens Heats Up
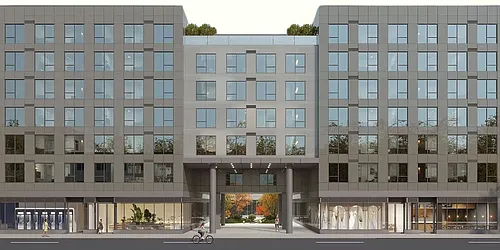
Buyers can find more options in Queens, the only borough where new listings are increasing from last year. As new developments continued to be added, 720 homes joined the market in Queens, up 9.4% from a year ago. Among the 720 homes, about one in ten (12.2%) were sponsor units in brand new condo buildings.
Buyer demand also appears resilient: 429 homes entered contract in Queens, up 10.3% from a year ago. With the market heating up, the median asking price of all listings in the borough rose 5.7% to $650,000 in March.
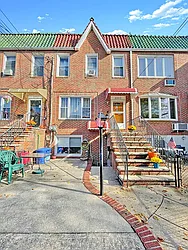
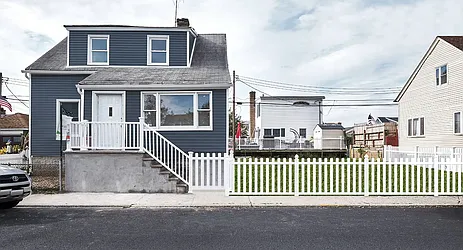
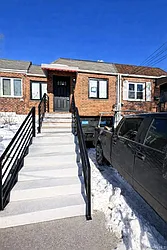
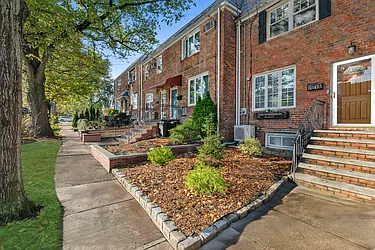
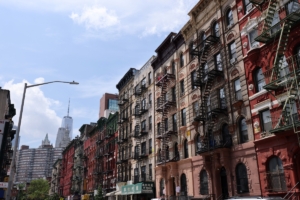
Queens Homes Under $1.5M on StreetEasy Article continues below
Outlook for Spring 2024
This year’s spring market will be more balanced than in 2022 and 2023, but limited new listings suggest well-priced homes on the market will continue to see competition among buyers. Coming up with a strong offer is crucial, and working with a buyer’s agent with local NYC market experience — such as those in StreetEasy’s Experts Network — can be a winning strategy.
Connect with the best Expert for your buying needsMortgage rates will likely remain elevated this spring as the Federal Reserve continues to wait for additional evidence of more significant cooling of inflation. However, when the Fed potentially cuts interest rates in the second half of this year, declines in mortgage rates could bring more new listings onto the NYC market. In the national market, there is more evidence that the effects of “rate lock-in” are already wearing off. New listings on Zillow were up 3.7% in March compared to last year, after rising 20.8% in February, according to Zillow’s March Housing Market Report.
While today’s high mortgage rates and asking prices may seem daunting, there are opportunities for buyers across the city at a wide range of price points. Ultimately, affordability depends on the buyer’s down payment and maximum amount of mortgage they can qualify for based on their interest rate and annual income. Our interactive map lays out the share of homes within reach by neighborhood based on a buyer’s maximum budget, determined by their income, down payment, and mortgage rate.
*Excludes luxury homes defined as the most expensive 10% of the market, and homes that sold at an extreme discount or premium for reasons specific to the home.
StreetEasy is an assumed name of Zillow, Inc. which has a real estate brokerage license in all 50 states and D.C. See real estate licenses. All data for uncited sources in this presentation has been sourced from Zillow data. All third-party product, company names and logos are trademarks of their respective holders and use of them does not imply any affiliation. Copyright © 2024 by Zillow, Inc. and/or its affiliates. All rights reserved.
