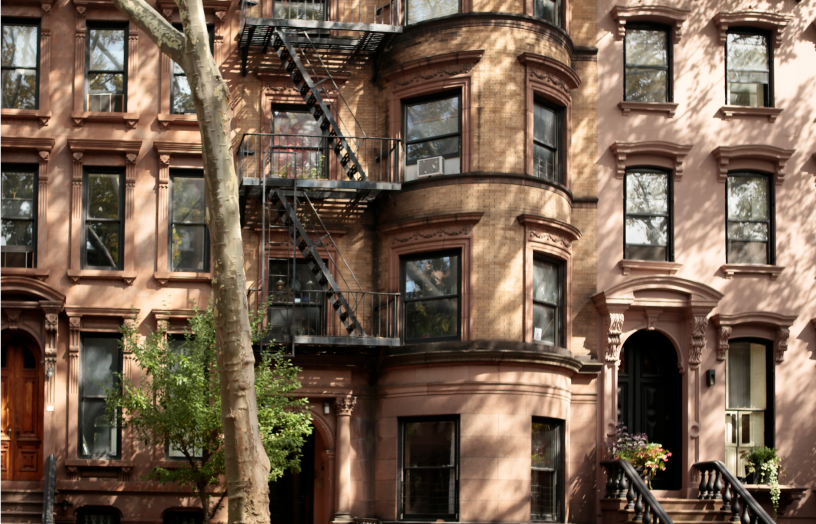
Brooklyn home prices fell further than Manhattan prices for the first time since 2018. (Getty Images)
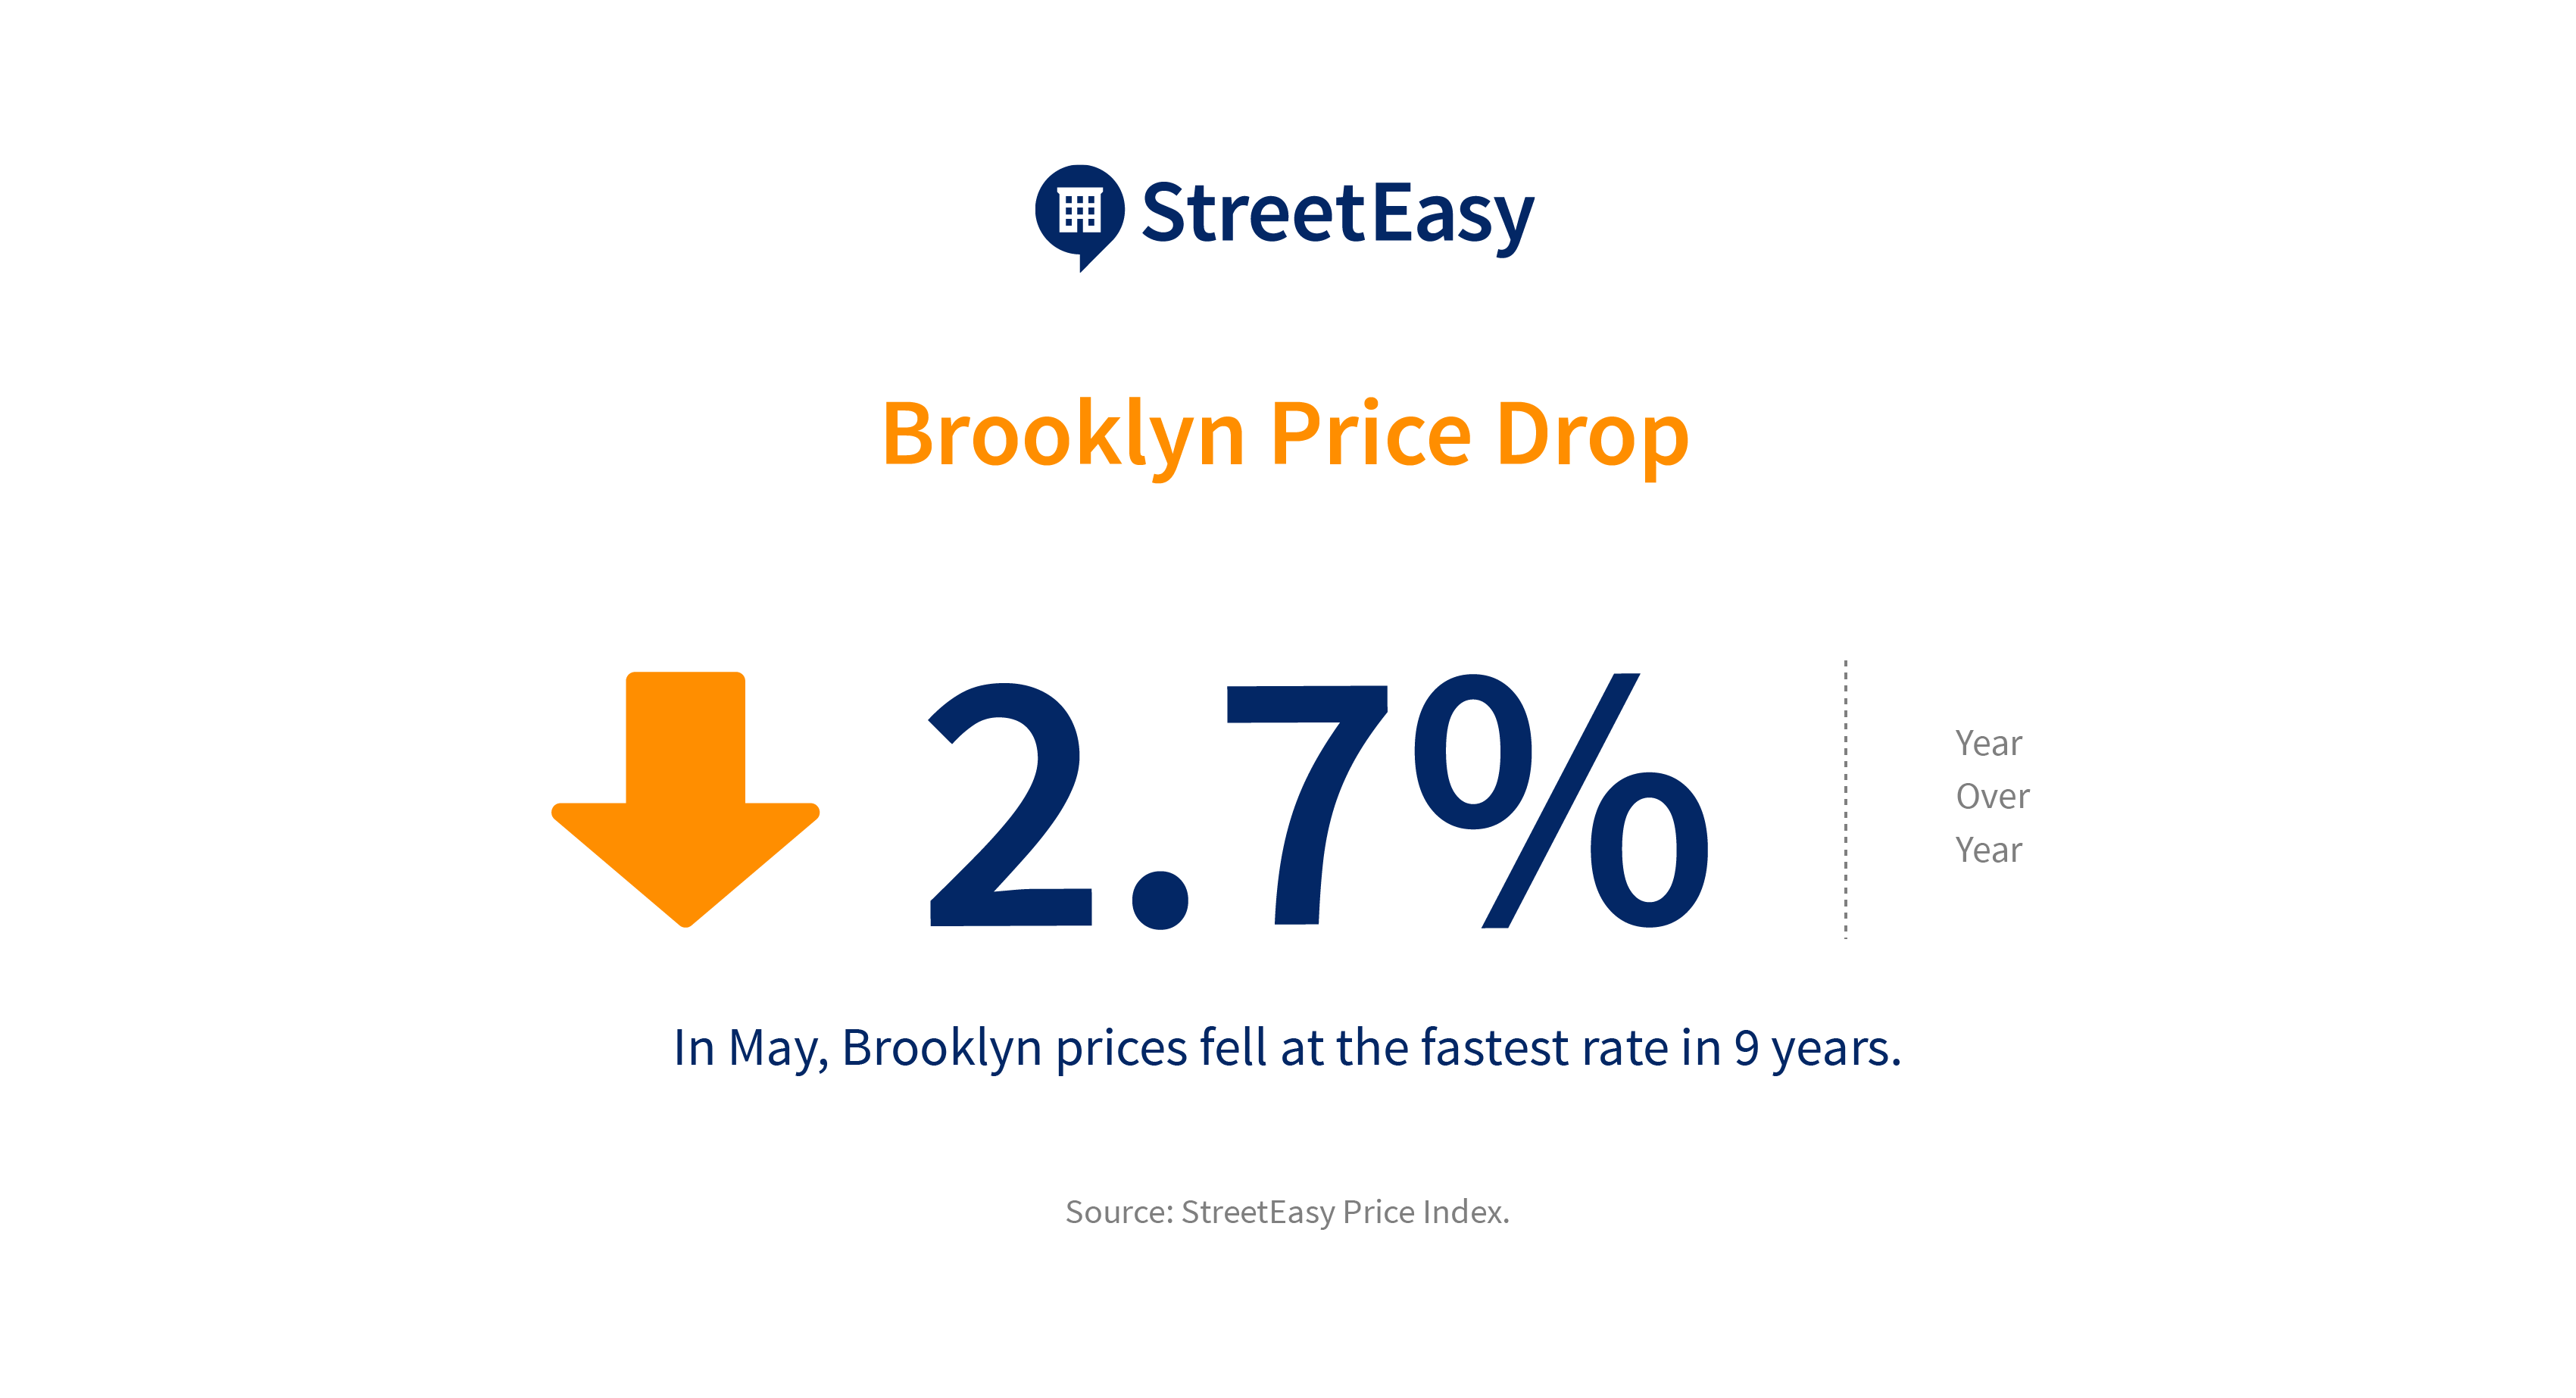
The StreetEasy Brooklyn Price Index[i] fell to $686,285 in May, a drop of 2.7% from last year, and the largest decline of all boroughs analyzed according to the StreetEasy Market Reports[ii]. The fall in prices was the largest drop in Brooklyn in nine years. It also marked the first time the borough saw a sharper decline in prices than Manhattan since the summer of 2018, when, led by Manhattan’s luxury sector, price growth across the city started to decline.
This latest drop in prices was driven mostly by two price sectors in Brooklyn: the most expensive homes, and the most affordable ones. Prices of Brooklyn’s luxury homes, which constitute the top 20% of the market, fell 2.9%, and prices of the bottom 20% of the market fell 4.5%.
 Luxury home prices in Brooklyn had already been falling year-over-year for the past 12 months, and with some buyers pulling back amid the coronavirus, the drop in prices became even more significant. Brooklyn’s most affordable homes were also heavily impacted, as New Yorkers looking to purchase in this price sector are more likely to be facing coronavirus-related financial hardships.
“Before the pandemic, prices in Brooklyn were relatively stable compared to the declines we were seeing in Manhattan, as buyers seeking affordability looked to the outer boroughs,” says StreetEasy Economist Nancy Wu. “Now, many searching for an affordable home are hitting the pause button as their employment and financial situations remain strained. The combination of the drop in demand and higher inventory levels has led to the rapid price decline we’re now seeing – welcome news for buyers searching for a home within their budget.”
See below for additional sales and rental market trends across Manhattan, Brooklyn, and Queens.
May 2020 Key Findings — Manhattan
The StreetEasy Manhattan Price Index dropped to $1,085,843, down 2.0% from last year and the smallest decline in over a year. Due to the lack of buyer activity, the amount of for-sale inventory in the borough also fell by 32.2% in May, with 6,856 homes on the market. On the other hand, the StreetEasy Manhattan Rent Index[iii] remained stagnant at $3,273 — the first time Manhattan rents did not have an annual increase since spring 2018. The slowdown in rent growth can be attributed to the significant uptick in rental discounts seen in May.
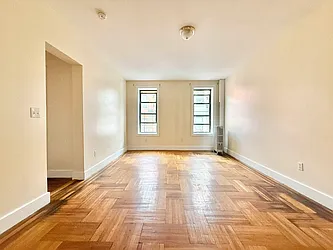
Brooklyn Rentals Under $3,000 on StreetEasy Article continues below


May 2020 Key Findings — Brooklyn
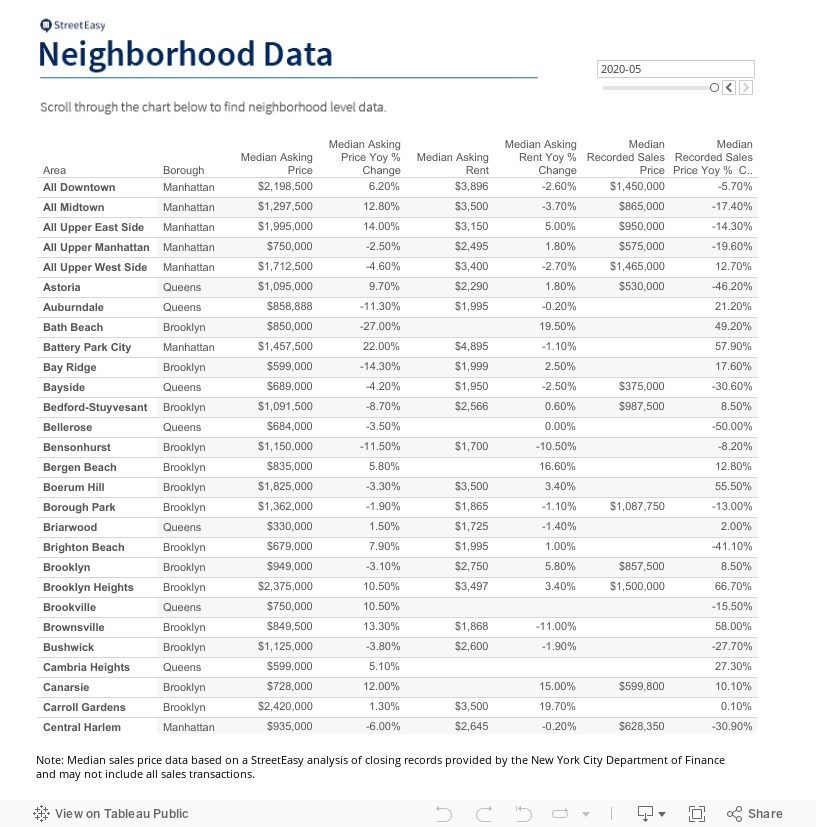
Brooklyn home prices fell the most in the city, driven largely by price drops for the most expensive and most affordable homes. Northwest Brooklyn[iv] and East Brooklyn[v] home prices dropped the furthest in the borough, by 4.5% and 3.0% respectively. These two submarkets experienced substantial inventory growth between 2014 and 2018 as a result of new construction. The StreetEasy Brooklyn Rent Index rose 3.7% to $2,744 — the slowest pace of rent growth in nine months.
May 2020 Key Findings — Queens
Home prices in Queens fell for the first time since 2013. The StreetEasy Queens Price Index dropped to $507,262, down 1.1% from last year. Total sales inventory also fell by 26.4% — the steepest decline on StreetEasy record (since 2010). 5.2% of homes in the borough received a price cut in May, which is 6.6 percentage points lower than last year, but up slightly from record lows in April. The StreetEasy Queens Rent Index rose 2.3% to $2,207 — the slowest pace of rent growth since November 2018.
View all StreetEasy Market Reports for Manhattan, Brooklyn, and Queens, with additional neighborhood data and graphics. Definitions of StreetEasy’s metrics and monthly data from each report can be explored and downloaded via the StreetEasy Data Dashboard.
[i] The StreetEasy Price Indices track changes in resale prices of condo, co-op, and townhouse units. Each index uses a repeat-sales method of comparing the sales prices of the same properties since January 1995 in Manhattan and January 2007 in Brooklyn and Queens. Given this methodology, each index accurately captures the change in home prices by controlling for the varying composition of homes sold in a given month. Levels of the StreetEasy Price Indices reflect average values of homes on the market. Data on the sale of homes is sourced from the New York City Department of Finance. Full methodology here.
[ii] The StreetEasy Market Reports are a monthly overview of the Manhattan, Brooklyn and Queens sales and rental markets. Every three months, a quarterly analysis is published. The report data is aggregated from public recorded sales and listings data from real estate brokerages that provide comprehensive coverage of Manhattan, Brooklyn and Queens, with more than a decade of history for most metrics. The reports are compiled by the StreetEasy Research team. For more information, visit https://streeteasy.com/blog/research/market-reports. StreetEasy tracks data for all five boroughs within New York City, but currently only produces reports for Manhattan, Brooklyn and Queens.
[iii] The StreetEasy Rent Indices are monthly indices that track changes in rent for all housing types and are currently available from January 2007 in Manhattan, January 2010 in Brooklyn, and January 2012 in Queens. Each index uses a repeat-sales method similar that used to calculate the StreetEasy Price Indices. The repeat method evaluates rental price growth based on homes in a given geography that have listed for rent more than once. More details on methodology here.
[iv] The Northwest Brooklyn submarket includes Downtown Brooklyn, Fort Greene, Brooklyn Heights, Boerum Hill, Dumbo, Red Hook, Gowanus, Carroll Gardens, Cobble Hill, Columbia St. Waterfront District and Clinton Hill.
[v] The East Brooklyn submarket includes Bed-Stuy, Bushwick, East New York, Crown Heights and Brownsville.
—
Whether you’re looking to rent or to buy, find your next NYC apartment on StreetEasy.