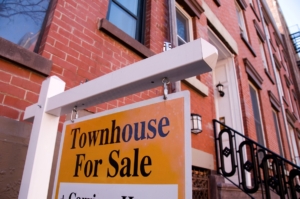
August 2026 NYC housing market report
Key takeaways:
NYC sales market
- Despite rising mortgage rates, 21.8% of NYC homes sold above their most recent asking price in August, following a 25.0% share in July — the highest since July 2022.
- Competition was strongest in Brooklyn, with 31.9% of homes selling above their latest asking price in August.
- Homes in NYC are entering contract faster than a year ago, with Brooklyn homes moving the fastest at a median of just 69 days.
- Homes that sold above asking stood out by reaching a broader audience and amplifying buyer interest, in addition to pricing competitively, according to StreetEasy® Performance Pulse scores.
NYC rental market
- The median asking rent in NYC held at a record high of $4,200 in August, but annual growth slowed to 2.8% from 7.5% a year earlier.
- As demand continued to outpace limited supply, the median asking rent in Manhattan rose 5.2% year-over-year to $4,995.
- Queens and the Bronx were the only boroughs that saw annual inventory growth, with 2.3% and 9.3% increases respectively.

NYC sales market
Despite recent mortgage rate jumps, this summer has remained particularly hot for home sales in the NYC market. More than one in five (21.8%) NYC homes sold above their latest asking price this August, up from 20.5% a year earlier. In July, 25.0% sold above asking, the highest since 2022 and significantly above 19.6% in July of last year. This market heat is a result of pent-up demand from NYC buyers who have been waiting on the sidelines, in the city’s often highly competitive rental market.

Resilient demand has also been supporting contract activity. Of the 21 weeks between April and July, 18 weeks recorded year-over-year increases in new contracts, including 12 weeks with growth exceeding 10%. Contract signings peaked mid-summer, with monthly volume rising 3.6% in April, 9.7% in May, 15.7% in June, and 15.0% in July.
However, the momentum softened ahead of Labor Day following typical seasonality. In the last week of August (8/24 – 8/30), 359 homes entered contract across the city, compared to 397 in the first week (8/3 – 8/9). In total, 1,666 new contracts were signed in August, down 5.4% from a year ago. Contract volume was more stable in Manhattan with a 0.9% decline, but fell 10.9% in Brooklyn and 7.9% in Queens.

A blazing summer left fewer homes on the market
Strong demand absorbed listings, pushing inventory down 5.0% year over year to 15,324 in August. The citywide inventory has been declining annually since February due to strong sales this year. In Manhattan, which led the growth in new contracts through this summer, inventory fell 11.2% to 7,032 homes. Inventory was more stable in Brooklyn, declining just 0.5% to 4,016 homes. By contrast, buyers can expect more options in Queens, where inventory rose 3.3% to 3,231 homes. New developments continued to lift inventory in Queens, in addition to strong increases in new co-op listings.
NYC homes under $980K on StreetEasy Article continues below

With fewer homes available, the market moved faster. Across the city, homes entering contract in August spent a median of 77 days on the market, four days fewer than a year ago. Median time on market fell by six days to 93 days in Manhattan and by three days to 69 days in Brooklyn. Queens was the only borough to see an increase in median time on market, up six days to 73 days, as inventory increased from a year ago.
Brooklyn had the highest share of homes selling above asking
Brooklyn led the city in above-asking sales in August with 31.9%, higher than 24.2% in Queens and 16.0% in Manhattan. Brooklyn’s share edged up from 31.5% a year earlier, while the shares in Manhattan and Queens also increased.

Citywide, some neighborhoods saw even stronger competition. In Park Slope, three in five homes (61.3%) sold above their last asking price. Greenwich Village also saw a high share of above-asking home sales (40.0%), followed by Bedford-Stuyvesant (34.8%) and Forest Hills (30.4%).
NYC neighborhoods with most homes sold above asking, August 2026
| Neighborhood | Borough | Share of above-asking home sales | All homes sold | Median sale price |
|---|---|---|---|---|
| Park Slope | Brooklyn | 61.3% | 31 | $1,875,000 |
| Greenwich Village | Manhattan | 40.0% | 30 | $1,797,000 |
| Bedford-Stuyvesant | Brooklyn | 34.8% | 23 | $1,650,000 |
| Forest Hills | Queens | 30.4% | 23 | $478,000 |
| Brooklyn Heights | Brooklyn | 26.7% | 15 | $1,850,000 |
| Astoria | Queens | 25.0% | 16 | $952,500 |
| Williamsburg | Brooklyn | 25.0% | 20 | $1,637,500 |
| Upper East Side | Manhattan | 20.7% | 140 | $1,390,500 |
| Upper West Side | Manhattan | 15.8% | 95 | $1,230,000 |
| Midtown East | Manhattan | 15.3% | 85 | $626,000 |
Maximizing exposure to buyers makes a difference
What set these high-performing listings apart was likely their ability to reach a broader audience and generate interest through marketing activities like open houses, appealing photography, and social media posts.
A listing’s StreetEasy Performance Pulse score estimates its likelihood of selling based on a wide range of information, including property details and buyer engagement. A higher score indicates a greater probability of a sale, and can help agents fine-tune their strategy in real time.
The median Performance Pulse score for homes that sold above asking in August was 73.5%. For those that sold at or below asking, it was 55.8%. The median Performance Pulse score for homes that were eventually delisted in August was 34.6%, less than half the median for those that sold above asking price.
Saves and views were the demand signals that primarily drove high-performing listings, compared to pricing. This indicates that while pricing was important, increasing buyer engagement mattered more.
What to look out for this fall
Since mortgage rates started rising this spring, NYC buyers have become more selective. As a result, demand has concentrated around homes that are priced and marketed well relative to comparable homes, helping many sell above asking. With mortgage rates expected to stay above 6.5% through the end of 2026, buyers will likely continue to focus on listings that offer the best value within their budgets. Sellers can improve their chances by combining effective marketing with realistic pricing to raise exposure to targeted buyers.
Additional increases in mortgage rates, however, could weaken buyer demand this fall. New listings at lower asking prices than a year ago have partly offset the impact of rising rates. Mortgage rates averaged 6.7% in August, but the citywide median asking price fell 2.0% year-over-year to $980,000. As a result, the monthly mortgage payment for a buyer putting 20% down on a median-priced NYC home fell 1.2% annually to $5,042. While still lower than a year ago, the estimated monthly mortgage payment in August was up 4.1% since January. If rates rise further, any remaining affordability improvement will likely disappear quickly.

Meanwhile, calendar effects may obscure the early effects of higher mortgage rates this September. With Labor Day falling later than usual and extending the summer lull into the first week of the month, the fall shopping season is off to a delayed start. In turn, September will likely record fewer new listings and contracts, albeit for reasons unrelated to broader economic conditions.
With heightened uncertainty in the US economy, mortgage rates could change quickly. Timing the market is tricky, especially when uncertainty is high. Focusing on fundamentals — like personal finances and local market dynamics — is a more time-tested strategy for both buyers and sellers.
NYC rental market: Rent growth slows, but affordability pressure persists
The citywide median asking rent held at $4,200 in August, the highest on StreetEasy record since 2010. While the median asking rent remained at its record high, the pace of increases has slowed in recent months. In August, the median increased 2.8% year-over-year, compared to 7.5% in August 2025 and 33.3% in August 2022 when renter competition reached its peak. The slower pace will help gradually narrow the gap between renters’ incomes and gradually catch up with rent prices, alleviating the pressure on NYC renters searching for their next home.

That said, with many New Yorkers feeling the weight of rising rents, there’s a long way to go until renters can feel a meaningful difference in affordability. The shortage of rental housing, particularly homes with multiple bedrooms, has increased rent burdens since the pandemic. In 2024, 53.4% of families with children spent more than 30% of their annual income on rent, up from 52.6% in 2019, according to StreetEasy analysis of the U.S. Census Bureau’s American Community Survey (ACS) microdata.
In August, the median asking rent for two-bedroom apartments rose 6.7% year-over-year to $4,800, outpacing a 4.0% increase for one-bedroom rentals and a 2.9% increase for studios. The faster growth reflects a deeper shortage of two-bedroom apartments. Compared to August 2019, two-bedroom inventory declined 30.0%, compared to declines of 21.4% for one-bedrooms and 16.5% for studios.
Manhattan remained the most competitive borough for renters in August as demand continued to outpace limited supply. The median asking rent rose 5.2% year-over-year to $4,995, and inventory fell 8.2% to 15,665 units. Concessions also became less common, with the share of rentals offering at least one month free declining 0.6pp to 12.2%.
NYC rentals under $4,000 on StreetEasy Article continues below

With competition spilling over to Brooklyn, the borough’s inventory fell 9.8% year-over-year to 12,843 units, the largest annual decline since October 2022 when soaring demand following the pandemic drained inventory. The median asking rent in Brooklyn was $3,995, up 4.4% from August of last year. Property managers scaled back concessions amid rising renter demand, with just 16.1% of Brooklyn rentals offering free months, down from 17.9% a year ago.
Queens and the Bronx were the only boroughs that saw annual inventory increases in August. Inventory rose 2.3% to 4,596 rentals in Queens and 9.3% to 1,119 in the Bronx, supported by new developments completed since the pandemic. As a result, the share of rentals with concessions was higher in Queens (17.9%) and the Bronx (35.1%) than in Manhattan (12.2%) and Brooklyn (16.1%). In all five boroughs, shares of rentals with concessions declined as low inventory continued to fuel competition.
NYC market data: August 2026
Sales
 NYC |
 Manhattan |
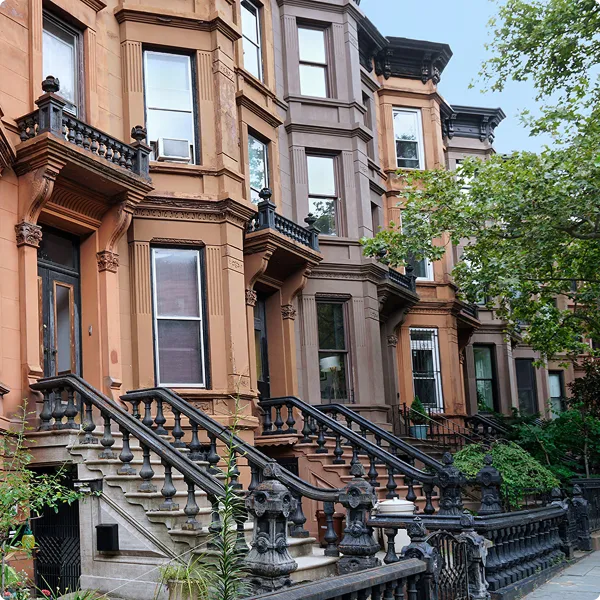 Brooklyn |
 Queens | |
|---|---|---|---|---|
| Median asking price | $980,000 (-2.0% YoY) | $1,330,000 (-4.9%) | $999,000 (-8.1%) | $695,000 (+0.1%) |
| Number of homes for sale | 15,324 (-5.0%) | 7,032 (-11.2%) | 4,016 (-0.5%) | 3,231 (+3.3%) |
| Homes entering contract | 1,666 (-5.4%) | 787 (-0.9%) | 432 (-10.9%) | 337 (-7.9%) |
| Median days on market | 77 (-4) | 93 (-6) | 69 (-3) | 73 (+6) |
Rentals
|
NYC |
Manhattan |
Brooklyn |
Queens | |
|---|---|---|---|---|
| Median asking rent | $4,200 (+2.8% YoY) | $4,995 (+5.2%) | $3,995 (+4.4%) | $3,450 (+4.2%) |
| Number of homes for rent | 34,275 (-7.1%) | 15,665 (-8.2%) | 12,843 (-9.8%) | 4,596 (+2.3%) |
| Share of rentals with price cuts | 16.0% (-2.6pp) | 19.9% (-2.5pp) | 13.4% (-2.8pp) | 12.1% (-2.2pp) |
| Share of rentals offering concessions* | 15.2% (-1.1pp) | 12.2% (-0.6pp) | 16.1% (-1.8pp) | 17.9% (-1.0pp) |
Thinking about buying in NYC? Chat with our complimentary, licensed Concierge to learn about the buying process.
StreetEasy is an assumed name of Zillow, Inc. which has a real estate brokerage license in all 50 states and D.C. See real estate licenses. StreetEasy does not intend to interfere with any agency agreement you may have with a real estate professional or solicit your business if you are already under contract to purchase or sell property. All data for uncited sources in this presentation has been sourced from Zillow data. Copyright © 2026 by Zillow, Inc. and/or its affiliates. All rights reserved.