
In April 2022, the median NYC home spent 46 days on the market. That’s 20 days fewer than April 2021, and the shortest amount of time since April 2016, when the median NYC home sold in 44 days. Homes tend to move off the market the fastest during the spring home shopping season, and April’s six-year low points to 2022 being one of the most competitive markets in years.
Prices are Rising, But Buyers are Still Buying
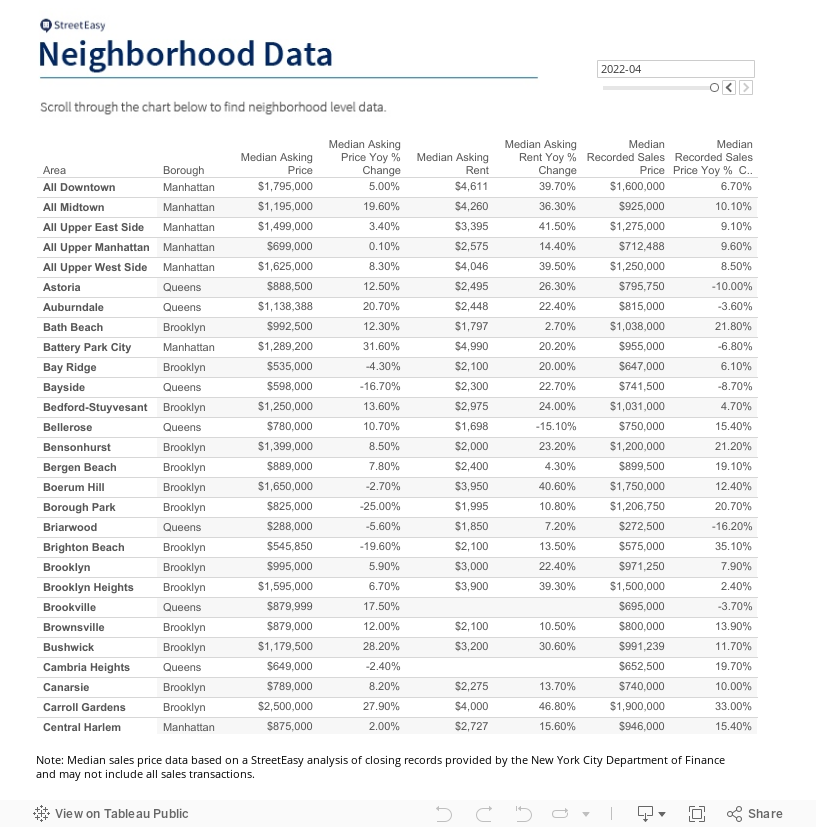
On top of the brisk pace of home sales, other factors pointed to strong buyer demand in April. The median asking price in NYC reached $995K, the highest it’s been since June 2019, and a 4.7% increase from last year.
In addition to rising prices, the number of homes that went into contract remained near the record highs we’ve seen since the resurgence of the market last spring. In-contract sales in April were not quite as high as they were in April 2021, when pent-up demand from buyers set the number of signed contracts soaring. However, the numbers are still elevated: in Manhattan, 1,525 homes went into contract in April, which aside from last year was the most the borough has seen since May 2013.
Buyers Still Have Many Options
With demand on the rise and more homes going into contract, many buyers may be worried that low inventory will make competition even tougher. For now, this is not the case. The number of homes on the market has increased month-over-month for the last three months.
In April, there were 19,000 homes for sale on StreetEasy. That’s near the pre-pandemic high of 20,735 homes that were available in the spring of 2019, when the market was moving much more slowly than it is today. This is a good sign for buyers this spring and summer, as many sellers are trying to take advantage of the current market dynamics and list while the market is hot.
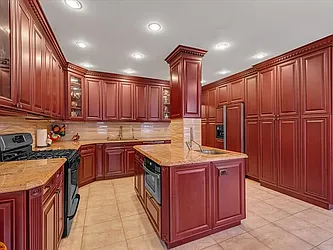
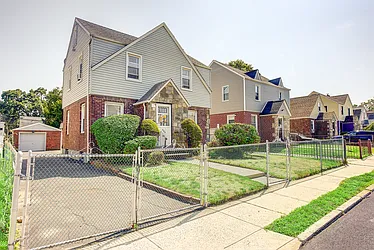
Manhattan Homes Under $1M on StreetEasy Article continues below


Will Strong Demand Persist?
The current market dynamics point to a competitive advantage for New York City sellers right now – but Zillow senior economist Josh Clark believes there are other factors at play.
“Across the country, the real estate market may be turning a corner toward normalcy, with rising interest rates and more sellers listing their homes,” says Clark. “New York City is extremely unique in that rising rates do not necessarily slow down demand. Cash buyers or those with large budgets who pay little to no mind to rising rates are still very much in the market to buy. For that reason, we may see a divide in which demand for luxury homes stays strong, while demand for homes in more affordable price tiers begins to soften.”
Advice for Sellers Who Want in on the Action
According to Meg Walhimer, a licensed real estate salesperson at Compass and a StreetEasy Expert, it’s a great time to list your home for sale.
“There’s been a noticeable uptick in calls coming in for home pricing evaluations and updates on the market,” says Walhimer.
“With the recent spike in rental prices, the monthly cost of renting versus buying in NYC is comparable, and is driving up buyer demand. This has pushed homeowners who were on the fence about selling to go ahead and list, and many are finding well-qualified buyers extremely quickly.”
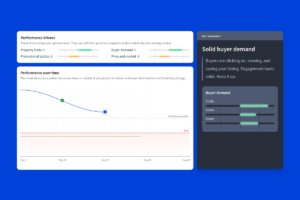
NYC homeowners interested in selling can view their Owner Dashboard on StreetEasy and receive access to their StreetEasy Valuation, an estimate of their property’s current market value. Homeowners will also see a customized selection of Expert agents who are well suited to sell their home based on past relevant experience.
Find out more about the sale and rental markets in Manhattan, Brooklyn, and Queens below.
Prices are Rising in Manhattan, But so are Price Cuts
The median asking price in Manhattan rose 7.4% year-over-year to $1.45M in April. This was the most significant annual increase of all boroughs analyzed. Still, the median asking price is 9% lower than it was in April 2019, the last full spring home shopping season the city had before the pandemic hit in 2020.
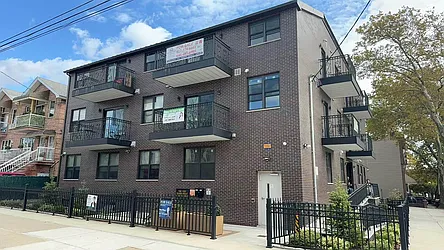
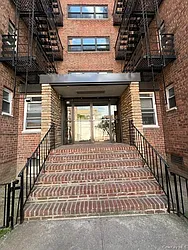
Manhattan Homes Under $1.5M on StreetEasy Article continues below


Of the for-sale listings on the market in Manhattan, 11.6% had a price cut in April. That is the highest share of price cuts seen so far this year, and slightly higher than April of last year when 10.9% of listings had a price cut. According to senior economist Josh Clark, rising price cuts are a good indicator that price growth may begin to stabilize.
Brooklyn Homes Reach Pre-Pandemic Prices
In Brooklyn, the median asking price jumped 6.6% year-over-year to $975K, the highest it’s been since May 2019. The median asking price in Brooklyn reached its record high of $990K in May 2018.
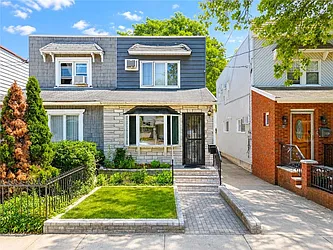
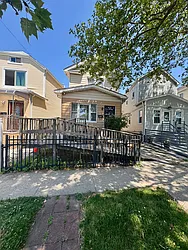
Brooklyn Homes Under $1M on StreetEasy Article continues below


Of Brooklyn’s for-sale listings in April, 8.8% had a price cut, unchanged from March and the highest share thus far in 2022. In September 2020, the share of price cuts in Brooklyn reached 16.9% – the record for the borough.
Queens Buyers Are in Good Position to Find a Deal
Despite the median asking price for homes in Queens rising for three months in a row, prices were still down 2.5% year-over-year to $599,450. Compared to April 2019, Queens prices are down 13.1%.
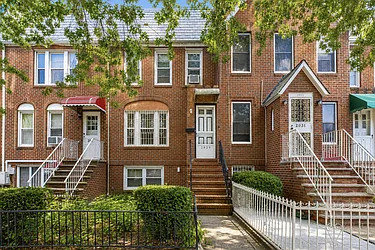
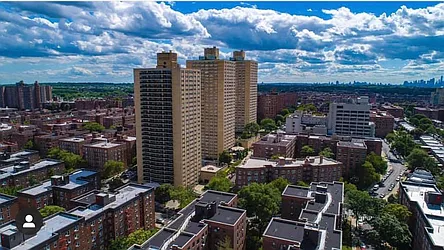
Queens Homes Under $750K on StreetEasy Article continues below


Similar to Manhattan and Brooklyn, the share of price cuts in Queens reached its highest level this year at 10.1%. This was down slightly from last April when 10.9% of homes on the market had a price cut.
For more data to help navigate the NYC home shopping process, view all StreetEasy Market Reports for Manhattan, Brooklyn, and Queens, with additional neighborhood data and graphics. Definitions of StreetEasy’s metrics, monthly data, and interactive charts from each housing market report can be explored and downloaded for free via the StreetEasy Data Dashboard.
Editor’s Note: In March 2020, New York City’s housing market temporarily froze as the COVID-19 pandemic reached the U.S. In 2021, the real estate market roared back to life, with demand returning to both the rentals and sales markets. Year-over-year data comparisons over the next few months will be made against the housing recovery that began in early 2021. Assuming 2022 is more typical of a “normal” year in housing than 2020 or 2021 were, with times of little to no activity followed by massive spikes in demand, we expect many of our year-over-year measures will show significant losses over last winter and spring. We urge you to use caution in extrapolating too much from year-over-year measures in the coming months, and we will always try to provide appropriate context to anchor reported changes in metrics to what is normal or expected.
Disclaimers: StreetEasy Valuation is our estimate for a home’s market value and is not an appraisal. Use it as a starting point to determine your home value and monthly rental price.
StreetEasy earns a referral fee from successful Experts’ transactions, at no cost to the buyer or seller. Experts must meet StreetEasy’s standards of service and market expertise. Agents in our Experts Network have closed deals on homes similar to the seller’s or similar to homes the buyer is searching for. We measure their performance to make sure buyers and sellers get top-notch service.